|
|
X: The standard abbreviation for exports produced by the foreign sector and purchased by the domestic economy, especially when used in the study of macroeconomics. This abbreviation is most often seen in the aggregate expenditure equation, AE = C + I + G + (X - M), where C, I, G, and (X - M) represent expenditures by the four macroeconomic sectors, household, business, government, and foreign. The United States, for example, sells a lot of the stuff produced within our boundaries to other countries, including wheat, beef, cars, furniture, and, well, almost every variety of product you care to name.
Visit the GLOSS*arama
|
|


|

|
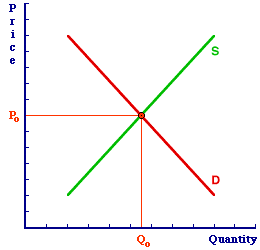
                           MARSHALLIAN CROSS: A diagram illustrating the market model, with price measured on the vertical axis and quantity measured on the horizontal axis, with the law of demand represented as a downward-sloping demand curve and the law of supply represented as an upward-sloping supply curve. The derivation of this name comes from the "Marshall" part of noted economist Alfred Marshall, and the intersection or "cross" of the demand and supply curves achieved at that market equilibrium. Marshallian cross is a somewhat dated reference to the standard market model diagram. The name pays tribute to Alfred Marshall, the economist responsible for formally developing this analysis in the late 1800s. It also provides contrast with another fundamental economic diagram, the Keynesian cross.| The Marshallian Cross |  |
This exhibit illustrates the basic Marshallian cross market model diagram. The vertical axis measures the price of the good. The horizontal axis measures the quantity of the good exchanged. The negatively-sloped demand curve, D, represents the law of demand. The positively-sloped supply curve, S, represents the law of supply.The intersection of the demand curve and supply curve at price Po and quantity Qo is the market equilibrium. A shift in either curve, caused by changes in the demand or supply determinants, results in a new equilibrium at, in all likelihood, a new price and new quantity. An interesting little twist to the Marshallian cross was added by Alfred Marshall. Conventional graphical analysis usually displays the independent variable (X) on the horizontal axis and the dependent variable (Y) on the vertical axis. This allows analytical types to manipulate the X-independent-variable and observe how the Y-dependent-variable changes. In the Marshallian cross, quantity would then be the X-independent variable and the price the Y-dependent variable. However, this configuration contrasts with typical uses of the market. Economists generally view price as the independent variable and quantity as the dependent variable. That is, they are concerned with how the price affects the quantity. In this context, price would work better on the horizontal axis, with quantity on the vertical. By convention and tradition, the placement of the two variables is reversed.

Recommended Citation:MARSHALLIAN CROSS, AmosWEB Encyclonomic WEB*pedia, http://www.AmosWEB.com, AmosWEB LLC, 2000-2025. [Accessed: July 11, 2025].
Check Out These Related Terms... | | | | | | |
Or For A Little Background... | | | | | |
And For Further Study... | | | | | | | | | | |
Search Again?
Back to the WEB*pedia
|


|

|
YELLOW CHIPPEROON
[What's This?]
Today, you are likely to spend a great deal of time browsing through a long list of dot com websites hoping to buy either looseleaf notebook paper or a three-hole paper punch. Be on the lookout for neighborhood pets, especially belligerent parrots.
Your Complete Scope
This isn't me! What am I?
|

|
|
Sixty percent of big-firm executives said the cover letter is as important or more important than the resume itself when you're looking for a new job
|

|
|
"If anything terrifies me, I must try to conquer it. " -- Francis Charles Chichester, yachtsman, aviator
|

|
AAT
Association of Accounting Technicians
|

|
|
Tell us what you think about AmosWEB. Like what you see? Have suggestions for improvements? Let us know. Click the User Feedback link.
User Feedback
|


|


