|
|
RESOURCE QUANTITY, AGGREGATE SUPPLY DETERMINANT: One of three categories of aggregate supply determinants assumed constant when the short-run and long-run aggregate supply curves are constructed, and which shifts both aggregate supply curves when it changes. An increase in a resource quantity causes an increase (rightward shift) of both aggregate supply curves. A decrease in a resource quantity causes a decrease (leftward shift) of both aggregate supply curves. The other two categories of aggregate supply determinants are resource quality and resource price. Specific determinants falling into this general category include population, labor force participation, capital stock, and exploration. Anything affecting the quantity of labor, capital, land, and entrepreneurship is also included.
Visit the GLOSS*arama
|
|


|

|
                           COLLUSION, EFFICIENCY: Colluding oligopolistic firms generally produce less output and charge a higher price than would be the case for a perfectly competitive industry. The efficiency of colluding oligopolistic firms is essentially the same as that for monopoly. In essence, colluding oligopolistic firms function just as if the market is a monopoly. The price charged by the colluding firms is higher than the marginal cost of production and the quantity is less. Most notably, price is greater than marginal, a violation of the key condition for efficiency. The reason that colluding oligopolistic firms are inefficient is found with market control. Because the colluding firms control the market like a monopoly, the market demand curve is THE demand curve facing the colluding firms. Because the demand curve is negatively sloped, price is greater than marginal revenue. And because these firms seek to maximize industry-wide profit by equating marginal revenue with marginal cost, the price charged is greater than marginal cost.Profit Maximization| Collusion Inefficiency | 
|
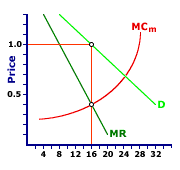
Consider the hypothetical production and sale of soft drinks in the Shady Valley area, controlled by two colluding oligopolistic firms, OmniCola and Juice-Up.A typical profit-maximizing output determination using the marginal revenue and marginal cost approach is presented in this diagram to the right. OmniCola and Juice-Up seek to maximize profit for this two-firm industry by producing output that equates industry-wide marginal revenue (MR) and industry-wide marginal cost (MCm), which is 16,000 cans of soft drinks in this example. The corresponding price charged is $1 per can. This profit-maximizing production is not efficient. In particular, the price is $1, but the marginal cost is only $0.40. Society is producing and consuming a good that it values at $1 (the price). However, in so doing, it is using resources that could have produced other goods valued at $0.40 (the marginal OPPORTUNITY cost). Society gives up $0.40 worth of value and receives $1. This is a good thing. It is so good, that society should do more. However, the colluding firms are not letting this happen. They are not devoting as many resources to the production of soft drinks as society would like. An Efficient AlternativeThe degree of inefficiency can be illustrated with a comparison to perfect competition. Such a comparison is easily accomplished by clicking the [Perfect Competition] button. A primary use of perfect competition is to provide a benchmark for the comparison with other market structures, such as colluding oligopolistic firms.A comparison between these colluding oligopolistic firms and perfect competition indicates: - The colluding firms produce less output than perfect competition. In this example, they produce 16,000 cans of soft drinks compared to about 24,250 cans for perfect competition. The colluding firms do not allocate enough resources to the production of soft drinks.
- The colluding firms charge a higher price than perfect competition. In this example, the collusion price is $1 per can versus $0.69 per can for perfect competition. The colluding firms are NOT efficient because they produce at a quantity in which price is greater than marginal cost.

Recommended Citation:COLLUSION, EFFICIENCY, AmosWEB Encyclonomic WEB*pedia, http://www.AmosWEB.com, AmosWEB LLC, 2000-2025. [Accessed: July 11, 2025].
Check Out These Related Terms... | | | |
Or For A Little Background... | | | | | | | | | | |
And For Further Study... | | | |
Search Again?
Back to the WEB*pedia
|


|

|
ORANGE REBELOON
[What's This?]
Today, you are likely to spend a great deal of time searching the newspaper want ads trying to buy either a country wreathe or galvanized steel storage shelves. Be on the lookout for vindictive digital clocks with revenge on their minds.
Your Complete Scope
This isn't me! What am I?
|

|
|
A thousand years before metal coins were developed, clay tablet "checks" were used as money by the Babylonians.
|

|
|
"If anything terrifies me, I must try to conquer it. " -- Francis Charles Chichester, yachtsman, aviator
|

|
KLCE
Kuala Lumpur Commodity Exchange (Malaysia)
|

|
|
Tell us what you think about AmosWEB. Like what you see? Have suggestions for improvements? Let us know. Click the User Feedback link.
User Feedback
|


|


