
|
|
REALISM OF MONOPOLY: If taken to the extreme, monopoly, like perfect competition is an ideal market structure that does not actually exist in the real world. In the extreme, a "pure" monopoly is a market containing one and only ONE seller of good, a good with absolutely, positively no substitutes. The product is absolutely, certifiably unique. It's not just that it has no CLOSE substitutes, it has NO substitutes. Period. End of story. In the real world, however, every product, no matter how seemingly unique it might appear, has substitutes. The substitutes might not be very close. They might be really, really bad substitutes. But they are substitutes. As such, there are no pure monopolies in the real world.
Visit the GLOSS*arama
|
|


|

|
                           TOTAL REVENUE CURVE, MONOPOLY: A curve that graphically represents the relation between the total revenue received by a monopoly firm for selling its output and the quantity of output sold. It is combined with a monopoly firm's total cost curve to determine economic profit and the profit maximizing level of production. The slope of the total revenue curve is marginal revenue. Monopoly is a market structure with a single firm selling a unique good. As the only firm in the market, monopoly is a price maker and has extensive market control, facing a negatively-sloped demand curve. If a monopoly wants to sell a larger quantity, then it must lower the price.The total revenue curve reflects the degree of market control held by a firm. For a perfectly competitive firm with no market control, the total revenue curve is a straight line. For firms with more market control, especially monopoly, the total revenue curve is "hump shaped," increasing, reaching a peak, then declining. The slope of this total revenue curve is marginal revenue. Total Revenue Curve,
Medicine Style | 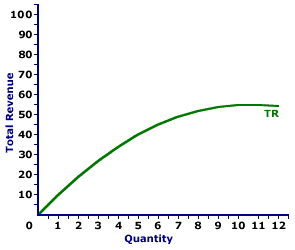 |
The total revenue curve for Feet-First Pharmaceutical is displayed in the exhibit to the right. Key to this curve is that Feet-First Pharmaceutical is a monopoly provider of a drug called Amblathan-Plus and thus faces a negatively-sloped demand curve. Larger quantities of output are only possible with lower prices.The vertical axis measures total revenue and the horizontal axis measures the quantity of output (ounces of medicine). Although quantity on this particular graph stops at 12 ounces of medicine, it could go higher. This curve indicates that if Feet-First Pharmaceutical sells 1 ounce of medicine (at $10 per ounce), then it receives $10 of total revenue. Alternatively, if it sells 10 ounces (at $5.50 per ounce), then it receives $55 of total revenue. Should it sell 12 ounces (at $4.50 per ounce), then it receives only $54 of total revenue. For Feet-First Pharmaceutical the total revenue "curve" actually is a "curve." The slope of this curve falls as more output is produced, eventually reaching a peak, then becoming negative. The changing slope of this curve is due to the changing price. Although this total revenue curve is based on the production activity of Feet-First Pharmaceutical, a well-known monopoly firm, it could also be for any firm with market control. Monopolistic competition and oligopoly firms that also face negatively-sloped demand curves generate comparable total revenue.
Recommended Citation:TOTAL REVENUE CURVE, MONOPOLY, AmosWEB Encyclonomic WEB*pedia, http://www.AmosWEB.com, AmosWEB LLC, 2000-2024. [Accessed: April 29, 2024].
Check Out These Related Terms... | | | | | | | | |
Or For A Little Background... | | | | | | | | |
And For Further Study... | | | | | | | | |
Related Websites (Will Open in New Window)... | | | |
Search Again?
Back to the WEB*pedia
|

|

|
RED AGGRESSERINE
[What's This?]
Today, you are likely to spend a great deal of time wandering around the shopping mall looking to buy either a birthday gift for your mother or a weathervane with a horse on top. Be on the lookout for malfunctioning pocket calculators.
Your Complete Scope
This isn't me! What am I?
|

|
|
The 22.6% decline in stock prices on October 19, 1987 was larger than the infamous 12.8% decline on October 29, 1929.
|

|
|
"Something in human nature causes us to start slacking off at our moment of greatest accomplishment. As you become successful, you will need a great deal of self-discipline not to lose your sense of balance, humility and commitment." -- H. Ross Perot
|

|
MPP
Marginal Physical Product
|

|
|
Tell us what you think about AmosWEB. Like what you see? Have suggestions for improvements? Let us know. Click the User Feedback link.
User Feedback
|

|

